首页Home / 客户成功案例Customer success

仿真指导实验
实验印证仿真
Simulation points the way
experiment confirms it

4 个跨工艺、跨材料体系的合作案例 — 从单喷嘴送粉到高熵合金元素蒸发,每一次仿真预测都拿到实验台上逐项比对。 Four collaborations spanning processes and material systems — from single-nozzle DED to HEA element evaporation. Every prediction was matched against experiment, line by line.

CASE 01 / 04 · 定向能量沉积 · DEDDIRECTED ENERGY DEPOSITION

单喷嘴送粉
稳定熔池尺寸提升粉末利用率
Single-nozzle DED:
stabilize the melt pool, lift powder efficiency

01挑战Challenge

客户在单喷嘴送粉的定向能量沉积工艺中,粉末利用率长期偏低 — 大量粉末未被熔化,落入熔池外、零件质量难以稳定。

In a single-nozzle DED setup, powder efficiency stayed stubbornly low — a large share of powder fell outside the melt pool unmelted, dragging down part quality.

02仿真发现What sim revealed

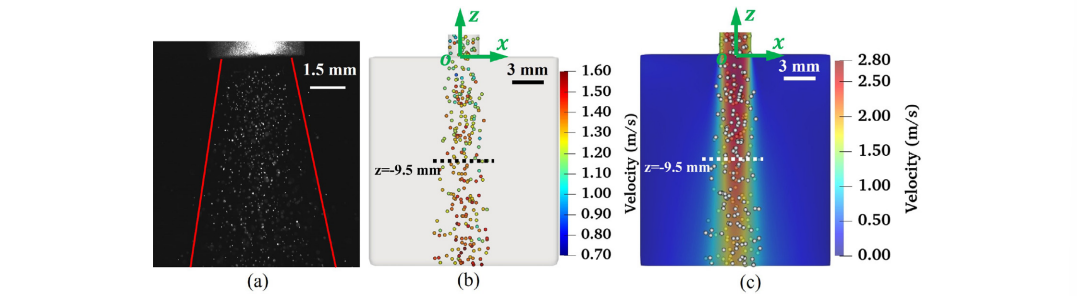
云熔智算把保护气速、载气流速、粉末轨迹与熔池尺寸一并耦合求解,找出了粉末利用率低的真实原因 — 粉束在熔池前缘飞溅与偏移。

YunRong coupled shielding-gas velocity, carrier-gas flow, particle trajectories and melt-pool geometry into one solve. The real cause: the powder stream deflecting and spattering at the melt-pool front.

03验证 & 结果Validation & result

仿真预测的熔池尺寸与实验结果一致。客户据此调整气流与扫描参数,熔池尺寸稳定、未熔化粉末显著减少、打印质量提升。

Predicted melt-pool dimensions matched experiment. The customer retuned gas flow and scan parameters — stable melt pool, far less unmelted powder, measurably better print quality.

喷嘴直径Nozzle Ø 3 mm
载气流量Carrier-gas flow 0.875 L/min
送粉速率Powder feed rate 3.775 g/min
仿真 ↔ 实验Sim ↔ Exp 熔池尺寸一致Pool size match
粉末分布 · 粉末速度 · 气体速度 — 仿真 vs 实验Powder distribution · powder velocity · gas velocity — sim vs experiment
Powder distribution and velocity fields, simulation vs experiment
(a) 实验 — 粉束散射范围 | (b)(c) 仿真 — 粉末与气体速度场 (t = 1.0 s) (a) Experiment — particle scatter envelope | (b)(c) Simulation — powder & gas velocity fields (t = 1.0 s)
CASE 02 / 04 · 电子束增材制造 · EBAMELECTRON-BEAM AM

钨颗粒增强铜基复合材料
仿真 ↔ 实验 90% 一致
W-particle reinforced Cu composites:
sim ↔ exp 90% match

01挑战Challenge

客户制备钨微颗粒增强铜基复合材料时,钨颗粒分布不均匀 — 大部分钨颗粒浮在熔池表面,难以参与组织强化。

While printing W-particle reinforced Cu composites, the tungsten particles distributed unevenly — most floated to the melt-pool surface and never reinforced the matrix.

02仿真发现What sim revealed

云熔智算对多组打印参数做参数扫描仿真,得到了不同条件下的钨颗粒分布形貌,并定位了颗粒上浮的物理机制 — 熔池对流将密度更大的钨颗粒推向自由表面。

A parameter sweep produced particle-distribution maps under different process conditions, and pinned the physics: melt-pool convection pushed the denser W particles toward the free surface.

03验证 & 结果Validation & result

仿真的熔池形貌与颗粒分布与实验取样达到 90% 一致。客户采用合适层厚 + 层间重熔策略,消除钨颗粒表面团聚,成功打印出颗粒分布均匀的样品。

Simulated fusion-zone morphology and particle distribution agreed with experiment at the 90% level. With a tuned layer thickness and inter-layer remelting, surface agglomeration was eliminated.

激光功率Beam power 425 W
扫描速度Scan speed 0.5 m/s
仿真 ↔ 实验Sim ↔ Exp 90%
策略Strategy 层厚 + 重熔Thickness + remelt
熔合区 · 仿真 (a1/b1/c1) vs 实验 (a2/b2/c2)Fusion zone · sim (a1/b1/c1) vs experiment (a2/b2/c2)
Fusion zone — simulation vs experimental cross-sections, W particles in Cu matrix
钨颗粒(灰)在铜基体(红)中的分布 — 仿真与金相对照 W particles (gray) in Cu matrix (red) — simulation vs metallography
CASE 03 / 04 · 选择性激光熔化 · SLMSELECTIVE LASER MELTING

TiB₂/Al 纳米颗粒复合材料
3 个月失败到 1 个月量产
TiB₂/Al nano-composites:
from 3-month failure to 1-month yield

01挑战Challenge

客户在 SLM 工艺下制备 TiB₂ 纳米颗粒增强铝基复合材料,强化颗粒持续团聚 — 连续 3 个月反复打印,始终无法获得分布均匀的样品。

Under SLM, TiB₂ nano-particles kept agglomerating in the printed Al matrix. After three months of iteration, the customer still couldn't produce uniformly reinforced samples.

02仿真发现What sim revealed

仿真还原了熔池对流与颗粒输运的耦合过程,揭示了强化颗粒在凝固前沿被推向边缘并团聚的机制,并就此提出多道次重熔的解决方案。

Simulation reproduced the coupled melt-pool flow and particle transport, exposing how particles were pushed and trapped at the solidification front. It prescribed a multi-pass remelting strategy.

03验证 & 结果Validation & result

客户按仿真最优参数 + 多道次重熔上机,在实验中首次实现了 TiB₂ 颗粒的均匀分布;从开始合作到首批合格样品,仅用一个月。

Running the simulated optimum + multi-pass remelting on-machine produced the first uniformly reinforced sample. Total time from engagement to qualified parts: one month.

激光功率Laser power 175 W
扫描速度Scan speed 0.75 m/s
扫描间距Hatch 40 μm
轨道重叠率Track overlap 60%
周期Cycle 3 月 → 1 月3mo → 1mo
颗粒分布演化 · 1st → 2nd → 3rd 重熔Particle distribution · 1st → 2nd → 3rd remelt
TiB₂ particle distribution evolves from clustered to uniform across remelt passes
从「缺颗粒区 / 富集区」到「均匀分布」— 多道次重熔的仿真演化 From lack-particle / enriched zones to uniform — multi-pass remelting evolution
层厚×重熔策略 · 颜粒走势对比Layer thickness × remelting · particle morphology
Particle aggregation — two-layer scan, lambda 60 microns
颗粒聚集Particle aggregation
Uniform particle distribution — one-layer scan
颗粒均匀分布Uniform distribution
CASE 04 / 04 · 选择性激光熔化 · SLM · 高熵合金SLM · HIGH-ENTROPY ALLOY

FeMnCoCr 高熵合金
量化 Mn 蒸发损失,可控成分打印
FeMnCoCr HEA:
quantify Mn evaporation, hit target composition

01挑战Challenge

在 SLM 工艺下打印 FeMnCoCr 高熵合金时,锰 (Mn) 元素因蒸气压高在熔池中持续蒸发流失,最终零件化学成分偏离设计值,合金性能无法达标。

During SLM of FeMnCoCr HEA, manganese — with its high vapor pressure — kept evaporating from the melt pool. Final parts drifted off-composition and missed alloy spec.

02仿真发现What sim revealed

云熔智算的元素蒸发模型在不同功率下定量预测了 Mn 的蒸发损失速率:Case 1 (180 W) 167.2 μg/s,Case 2 (270 W) 364.7 μg/s — 功率越高、损失越大。

YunRong's element-evaporation model quantified Mn mass-loss rate per process window: 167.2 μg/s at 180 W vs 364.7 μg/s at 270 W. Higher power, faster Mn drain.

03验证 & 结果Validation & result

预测的 Mn 含量与实验测量高度一致(Case 1: 仿真 33.0 vs 实验 33.1;Case 2: 仿真 31.7 vs 实验 30.9)。客户据此调整工艺参数与合金预补偿成分,实现可控 Mn 含量的高熵合金零件打印。

Predicted Mn matched measurement to within tenths of a percent (33.0 vs 33.1 at 180 W; 31.7 vs 30.9 at 270 W). The customer used these predictions to pre-compensate the alloy and tune the process, hitting target composition on-machine.

激光功率Laser power 180 W / 270 W
扫描速度Scan speed 0.6 m/s
Case 1 · 180 W
Case 2 · 270 W
实验Exp
33.1
30.9
仿真Sim
33.0
31.7
Mn 浓度场 · 蒸发损失曲线Mn concentration field · mass-loss curve
Mn concentration distribution under 180W vs 270W, with mass-loss curve and EDS results
Wang L. et al. · Advanced Functional Materials, 2024 · 2412071Adv. Funct. Mater. 2024 · 2412071

你的零件
会是下一个案例吗?
Will your part
be the next case?